Observatory
A backyard radio telescope.
Every atom of neutral hydrogen in the galaxy hums at one radio frequency: 1420.406 MHz, a wavelength of 21 centimeters. Point an antenna anywhere along the Milky Way, average patiently, and the hum rises out of the noise. This page is where SignalDispatch stops reading the record and starts taking its own.
The sky in hydrogen
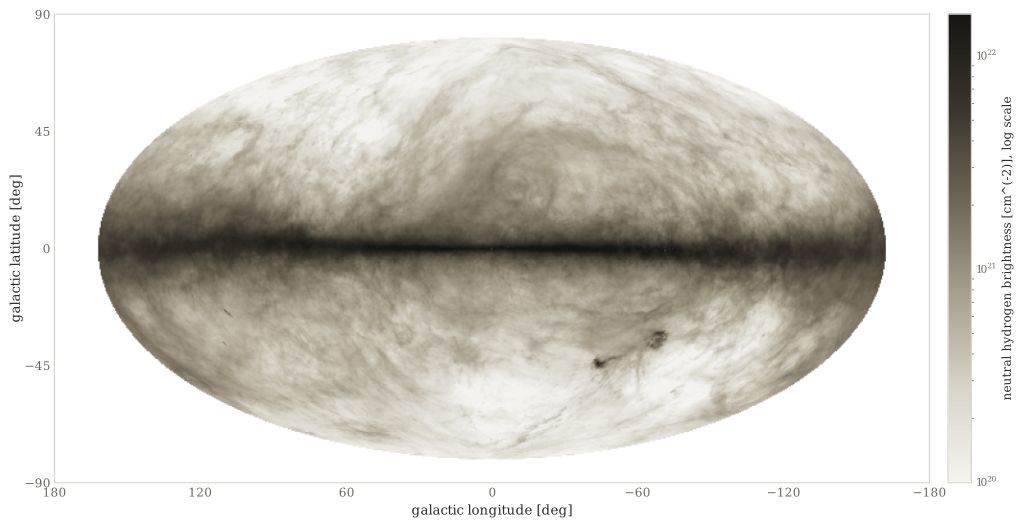
What the whole sky looks like on the hydrogen line.
Column density of neutral hydrogen across the entire sky, from the HI4PI survey — the combined work of two of the largest radio telescopes on Earth. The bright band is the plane of the Milky Way.
Spectra
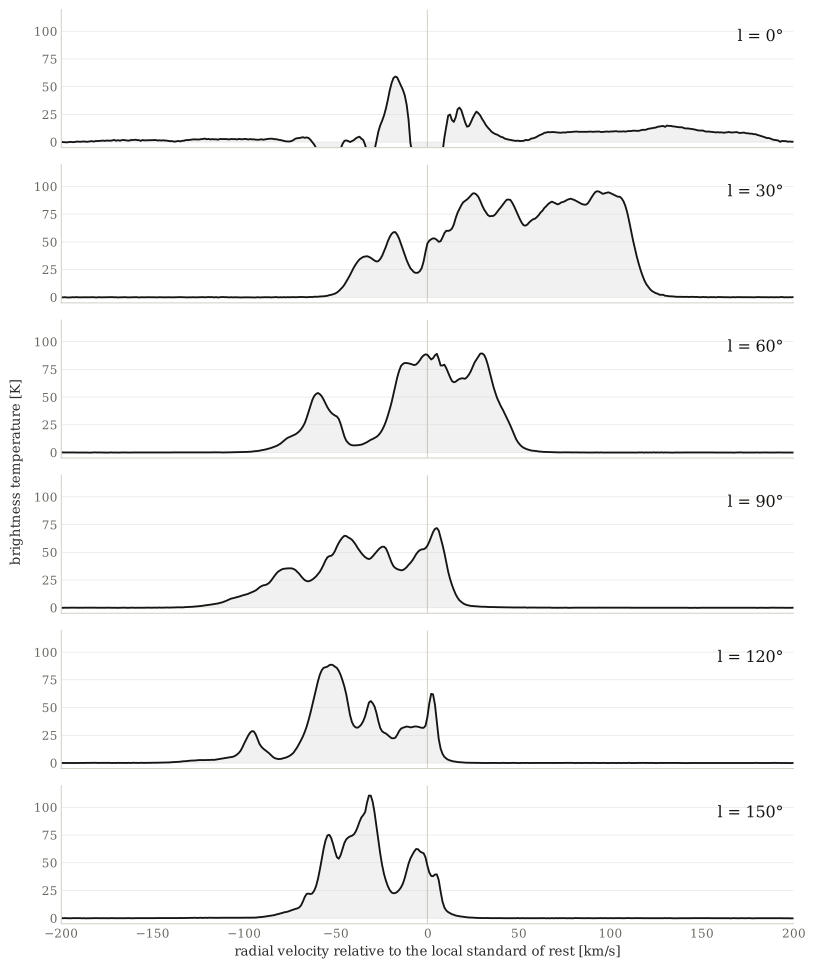
The line moves. That is the galaxy turning.
Six spectra along the galactic plane from the Leiden/Argentine/Bonn survey. Each panel is one direction of gaze; the horizontal axis is velocity toward or away from us. The peaks shift and split from panel to panel because different spiral arms move at different speeds along each line of sight — measured this way, with instruments not much grander in principle than the one under construction, the Milky Way's rotation was mapped and the dark matter problem was born.
First light
Where the backyard data will go.
When the dish sees the hydrogen peak for the first time, its spectrum publishes here next to the survey data it will be judged against. The build log will record what worked, what did not, and what the noise floor had to say about it.
Bench test: receiver chain verified indoors, bias tee powering the feed amplifier.
First light: the hydrogen peak, once, pointed at the galactic plane. Everything after this is refinement.
Autonomy: scheduled drift scans, calibrated and logged nightly without a human at the keyboard.
Publication: nightly spectra land on this page with observing conditions attached.
Data and credits
HI4PI Collaboration, Astronomy & Astrophysics 594, A116 (2016). All-sky map retrieved via NASA SkyView.
Kalberla et al., Astronomy & Astrophysics 440, 775 (2005). Spectra retrieved from the EU-HOU LAB profile server at AIfA Bonn.
McGlynn et al., NASA GSFC. Survey imagery as a queryable service.